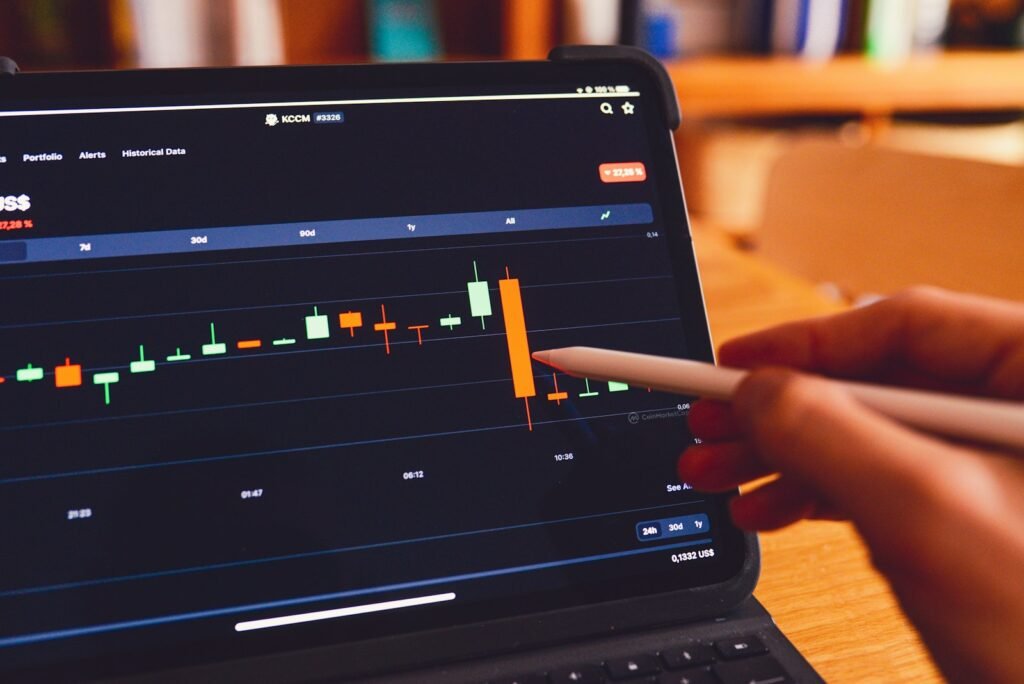
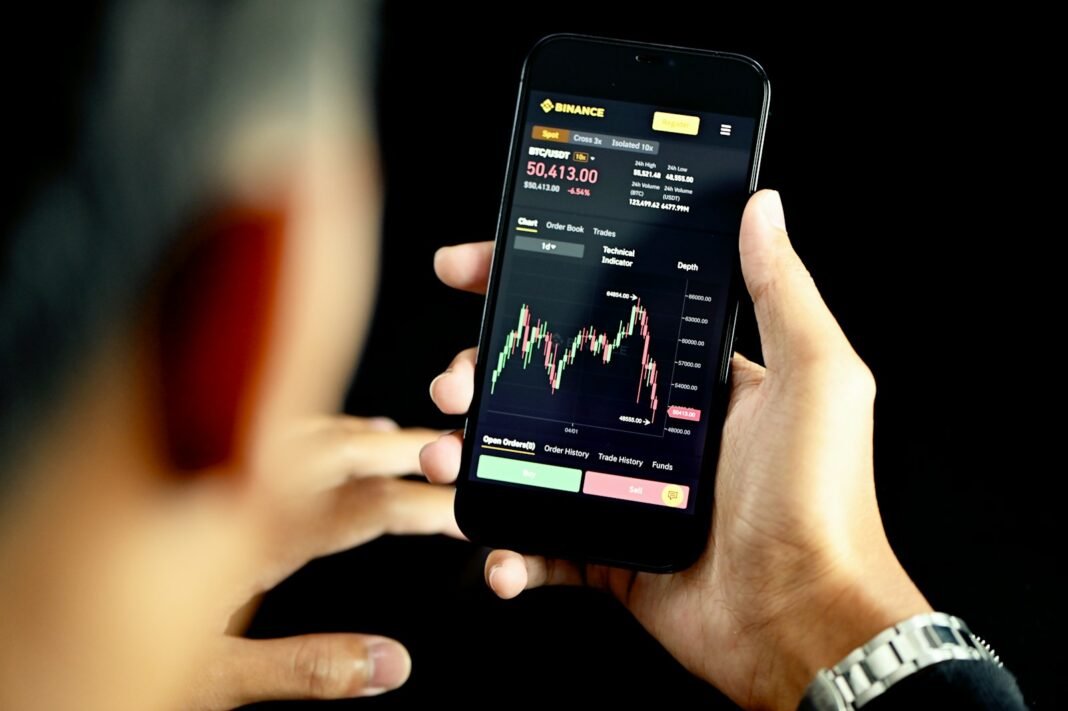
Navigating the volatile waters of cryptocurrency trading requires more than just intuition; it demands a solid understanding of market dynamics and the tools to interpret them. While price charts tell a story of past movements, crypto trading indicators serve as the analytical tools that help traders forecast potential future price action. These mathematical calculations, derived from historical price and volume data, are essential for developing a disciplined trading strategy. However, with dozens of indicators available, knowing which ones to use and how to interpret their signals can be challenging. This guide explores some of the most effective crypto trading indicators, explaining how they work and how you can integrate them into your decision-making process to identify opportunities and manage risk.
Also Read: CEX vs DEX: Which Crypto Exchange Is Right for You?
The Role of Indicators in Crypto Trading
Crypto trading indicators are not crystal balls, but rather instruments that provide insights into market sentiment, momentum, volatility, and trend strength. They help traders move beyond emotional reactions by offering data-driven signals. Indicators generally fall into several categories: trend indicators that show the direction of the market, momentum indicators that measure the speed of price changes, volume indicators that confirm the strength of a move, and volatility indicators that show how much the price is fluctuating. The key to using them effectively lies in understanding that each indicator has strengths and limitations. No single indicator provides perfect signals, which is why experienced traders often use a combination of indicators to confirm their trading thesis before entering or exiting a position.
Moving Averages: The Trend Spotter
Among the most fundamental crypto trading indicators are Moving Averages (MAs). A Moving Average smooths out price data by creating a constantly updated average price over a specific period. The two primary types are the Simple Moving Average (SMA) and the Exponential Moving Average (EMA). The SMA calculates the average price over a set number of periods, giving equal weight to each data point. The EMA, however, places greater weight on recent prices, making it more responsive to new information. Traders use MAs to identify the direction of the trend. When the price is above a key moving average, such as the 50-day or 200-day EMA, it often indicates an uptrend. Conversely, when the price trades below, it suggests a downtrend. A popular strategy involves watching for crossovers, such as when a shorter-term MA (like the 20-day) crosses above a longer-term MA (like the 50-day), which can signal a potential bullish trend reversal.
Also Read: Crypto Wallets: Hot vs Cold Storage Comparison
Relative Strength Index (RSI): The Momentum Gauge
The Relative Strength Index (RSI) is a momentum oscillator that measures the speed and change of price movements. It oscillates between 0 and 100 and is typically used to identify overbought or oversold conditions. Generally, an RSI reading above 70 suggests an asset may be overbought and potentially due for a correction or pullback. A reading below 30 indicates it may be oversold and could be poised for a bounce. However, in strongly trending markets, the RSI can remain in overbought or oversold territory for extended periods. Therefore, many traders also look for divergences between the RSI and the price action. For example, if the price of a cryptocurrency makes a new high but the RSI makes a lower high, it is known as a bearish divergence and can signal weakening momentum ahead of a potential price decline.
Bollinger Bands: The Volatility Measure
Bollinger Bands are a versatile indicator that provides information about both trend and volatility. They consist of three lines: a simple moving average (the middle band) and an upper and lower band that are standard deviations away from the middle band. When volatility increases, the bands widen; when volatility decreases, the bands contract. Traders often use Bollinger Bands to identify potential overbought and oversold conditions. When the price touches or moves above the upper band, the asset may be overextended to the upside. When it touches the lower band, it may be oversold. Another common strategy is to watch for the “squeeze,” which occurs when the bands come very close together. This often indicates a period of low volatility that can be followed by a significant price move in either direction.
Also Read: How to Buy Ethereum: The Complete Beginner’s Guide
MACD: The Trend and Momentum Combo
The Moving Average Convergence Divergence (MACD) is a powerful indicator that combines trend and momentum analysis. It consists of two lines: the MACD line and the signal line, along with a histogram that represents the difference between them. When the MACD line crosses above the signal line, it generates a bullish signal, suggesting it might be a good time to buy. A cross below the signal line generates a bearish signal. Traders also watch for divergences between the MACD and the price. For instance, if the price makes a new low but the MACD forms a higher low, it indicates that downward momentum is slowing and a reversal to the upside could be imminent. The MACD is particularly useful for confirming trend changes identified by other indicators.

Volume: The Market Strength Confirmation
While not an indicator in the traditional sense, trading volume is a critical component of technical analysis. Volume confirms the strength of a price move. A price increase on high volume is viewed as a stronger, more legitimate move than one on low volume. Many crypto trading indicators incorporate volume, such as the On-Balance Volume (OBV) indicator, which adds volume on up days and subtracts volume on down days to show whether money is flowing into or out of an asset. If the price is rising but OBV is flat or falling, it suggests that the uptrend may not be supported by strong buying pressure and could reverse. Always cross-reference price-based signals with volume data to validate their significance.
Also Read: How to Buy Bitcoin: Step‑by‑Step Tutorial
Creating a Balanced Indicator Strategy
The biggest mistake new traders make is overloading their charts with too many indicators, leading to “analysis paralysis.” A more effective approach is to select a few complementary indicators from different categories. For example, you might use a moving average to define the trend, the RSI to gauge momentum, and Bollinger Bands to assess volatility. When these indicators align, such as the price being above its 200-day EMA (uptrend), the RSI bouncing from oversold territory (momentum shift), and the price touching the lower Bollinger Band (potential oversold), it creates a higher-probability trading signal. Remember, indicators are meant to guide your decisions, not make them for you. They should be used in conjunction with other forms of analysis, including support and resistance levels and market news.
Conclusion: Mastering the Tools of the Trade
Crypto trading indicators are invaluable tools for any trader seeking to navigate the markets with greater confidence. From the trend-following simplicity of moving averages to the momentum insights of the RSI and the volatility measurements of Bollinger Bands, each indicator offers a unique perspective on market behavior. The key to success lies not in finding a perfect indicator, but in understanding how to use a select few effectively, interpreting their signals in the context of the overall market trend and volume. By integrating these tools into a disciplined trading plan, you can filter out market noise, identify high-probability setups, and ultimately make more informed and rational trading decisions.

