
Entering the world of cryptocurrency can feel like learning a new language, and nowhere is this more apparent than when faced with your first crypto chart. Those colorful candlesticks, swirling lines, and constantly updating numbers might seem intimidating at first glance. However, learning to read crypto charts is an essential skill for anyone looking to navigate the digital asset markets with confidence. This isn’t about predicting the future with certainty; it’s about understanding market sentiment, identifying trends, and making informed decisions based on data. This guide will demystify the process, breaking down the fundamentals of crypto technical analysis into simple, actionable steps. By the end, you’ll be able to look at a chart and see a story unfolding, rather than just a confusing collection of lines and shapes.
Also Read: CEX vs DEX: Which Crypto Exchange Is Right for You?
Understanding the Basic Layout of a Crypto Chart
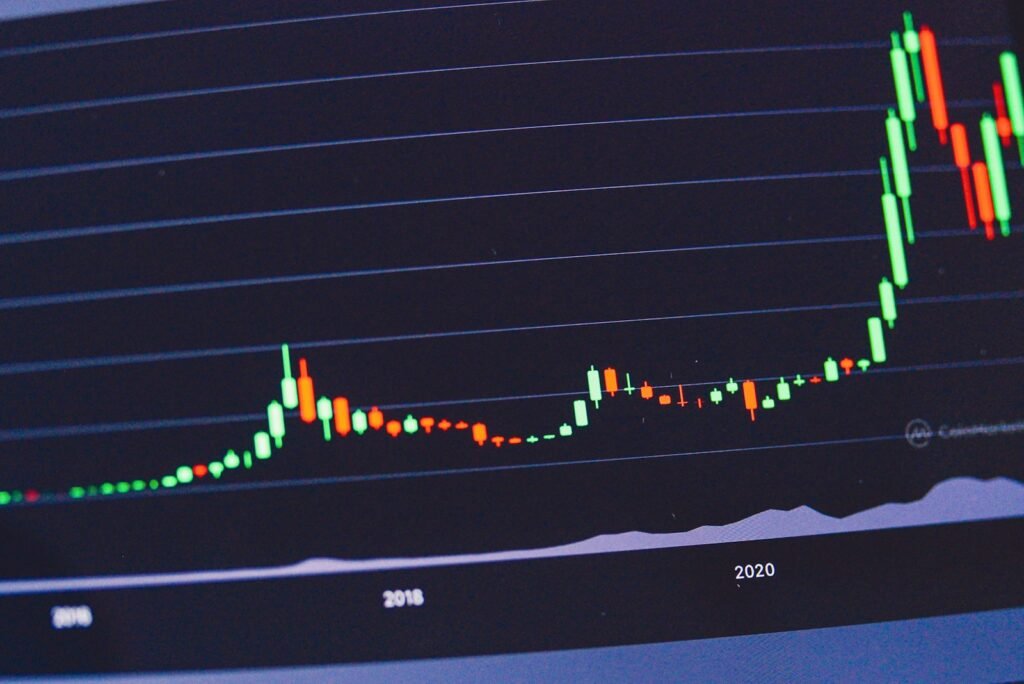
Before diving into complex indicators, it’s crucial to understand the basic components of a chart. Most crypto charts are built around a price and time axis. The horizontal axis (x-axis) represents time, which can be set to different intervals like minutes, hours, days, or weeks. The vertical axis (y-axis) represents the price. The most common type of chart used in crypto technical analysis is the candlestick chart. Each “candlestick” on this chart provides a wealth of information about the price action during a specific time period. The body of the candlestick shows the opening and closing prices, while the thin lines above and below, called “wicks” or “shadows,” indicate the highest and lowest prices reached during that period. A green or white candlestick typically means the price closed higher than it opened (a bullish signal), while a red or black candlestick means it closed lower (a bearish signal).
The Foundation: Support and Resistance
The first and most critical concept to grasp when you read crypto charts is support and resistance. These are fundamental to crypto technical analysis and form the bedrock of many trading strategies. Think of support as a floor and resistance as a ceiling. The support level is a price point where buying interest is strong enough to prevent the price from falling further. It’s where demand steps in. Conversely, the resistance level is a price point where selling pressure is strong enough to prevent the price from rising further. It’s where supply overwhelms demand. By identifying these levels on a chart, often seen as price points where the asset has reversed direction multiple times in the past, you can anticipate potential areas where the price might bounce or break through, helping you make decisions about entry and exit points.
Also Read: Crypto Wallets: Hot vs Cold Storage Comparison
Identifying Trends: The Trader’s Compass
Markets rarely move in a straight line; they trend. A primary goal of crypto technical analysis is to identify the direction and strength of these trends. An uptrend is characterized by a series of higher highs and higher lows. This indicates that buyers are in control, and the overall sentiment is bullish. A downtrend, on the other hand, is marked by lower highs and lower lows, signaling that sellers are dominant and the sentiment is bearish. Sometimes, the market moves sideways, consolidating within a range without a clear upward or downward direction. Drawing a simple trendline, a straight line connecting successive highs or lows, can help you visualize the trend. Trading in the direction of the trend is generally considered a safer strategy than trying to fight it.
Introduction to Key Technical Indicators
While price action itself tells a story, technical indicators are tools that help analyze that story more deeply. They are mathematical calculations based on historical price and volume data. When you read crypto charts, you’ll often see these indicators plotted below or overlaid on the price chart. Two of the most popular and accessible indicators for beginners are the Moving Average (MA) and the Relative Strength Index (RSI). A Moving Average smooths out price data to create a single flowing line, making it easier to identify the direction of the trend. The RSI measures the speed and change of price movements, indicating whether an asset is overbought (potentially overvalued) or oversold (potentially undervalued). These indicators don’t provide guarantees, but they offer valuable clues about market conditions.
Also Read: How to Buy Ethereum: The Complete Beginner’s Guide
Volume: The Power Behind the Move
Price tells you what is happening, but volume tells you how significant it is. Volume is the number of coins or tokens traded within a specific period and is a critical component of crypto technical analysis. A price movement with high volume is seen as a stronger, more legitimate move because it indicates broad market participation. For example, if the price of a cryptocurrency breaks above a key resistance level on high volume, it suggests strong conviction among buyers and increases the likelihood that the breakout will sustain. Conversely, a price movement on low volume might be less trustworthy and could reverse quickly. Always pay attention to the volume bars typically displayed at the bottom of the chart to confirm the strength of a trend or a potential reversal.
Putting It All Together: A Practical Example
Let’s imagine you are looking at a Bitcoin chart. You notice that the price has bounced off a specific level, say $50,000, three times in the past. This establishes a strong support level. The price is now approaching $50,000 again. You also see that the 50-day Moving Average is sloping upward, indicating a longer-term uptrend is intact. The RSI is reading 35, which is nearing oversold territory, suggesting selling pressure may be exhausting. Finally, you notice that the volume has started to increase as the price nears the support level. This confluence of factors supports an upward trend, an oversold RSI, and rising volume, which paints a picture that a rebound from $50,000 is a plausible scenario. This is how you synthesize different elements of crypto technical analysis to form a thesis.
Also Read: How to Buy Bitcoin: Step‑by‑Step Tutorial
Common Mistakes Beginners Make
As you learn to read crypto charts, it’s important to be aware of common pitfalls. One major mistake is relying on a single indicator. No indicator is perfect, and using them in combination provides a much more robust analysis. Another error is ignoring the larger timeframes. A chart showing one-minute intervals might look chaotic, while a daily or weekly chart can reveal a clear, long-term trend. Finally, emotional trading is the enemy of good technical analysis. The charts provide data, but discipline is required to act on that data without being swayed by fear of missing out (FOMO) or panic selling.
Conclusion: Charting Your Path Forward
Learning to read crypto charts is a journey, not a destination. It takes practice and patience to become proficient in crypto technical analysis. Start by familiarizing yourself with the basic components: candlesticks, support and resistance, and trends. Then, gradually incorporate simple indicators like moving averages and the RSI. Remember, the goal is not to find a magical formula for guaranteed profits but to manage risk and improve your probability of success.
